Flood and landslide maps in Costa Rica: what they show, and what they miss
Costa Rica publishes official flood and landslide maps, free to anyone. They are also drawn at a scale coarser than a building lot, and the fine print says so.
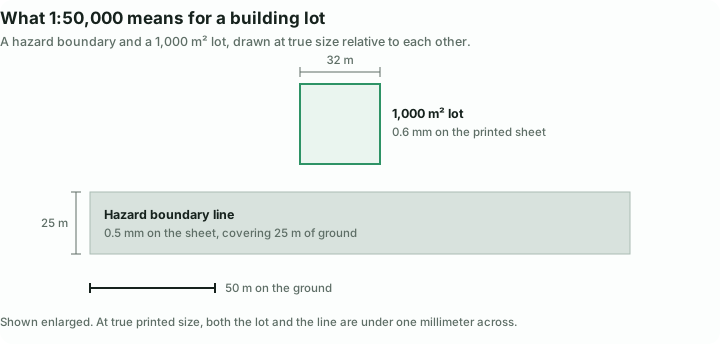
Costa Rica's national hazard maps are drawn at a scale of 1:50,000. At that scale, a line half a millimeter wide covers 25 meters of ground, so the boundary of a flood zone is wider than many building lots are long. Know that before you use the maps, which are otherwise useful and free.
Key points
- Two public routes exist, both free and neither requiring mapping software: a printable PDF sheet per canton, and an interactive national map.
- The maps show amenaza (hazard), not riesgo (risk). Costa Rican law distinguishes the two, which is why no map can tell you whether a specific house is in danger.
- The agency warns that a blank area on the sheet may simply not have been surveyed.
- What you may build is set by the uso de suelo certificate from your municipality; the maps only inform it.
Hazard and risk in Costa Rican law
Costa Rica's emergency law, Ley N.º 8488, defines two words that get used interchangeably in English and mean different things here.
Amenaza, hazard, is the latent danger that a damaging natural event may occur. Riesgo, risk, is the probability of actual loss, and the law defines it as hazard combined with the vulnerability of whatever is exposed to it.
The maps published by the Comisión Nacional de Prevención de Riesgos y Atención de Emergencias (CNE) are amenaza maps: they record where the country's natural hazards are, at national scale, and say nothing about a particular building, its foundations, its drainage or its elevation relative to a river a few meters away. A flood-potential polygon over your neighborhood does not mean your house floods, and a neighborhood without one may still flood.
The distinction comes from the statute the maps are made under. Use the maps to find where to look more closely; they cannot tell you whether a property is safe.[1]
Route one: the canton sheet
The simplest route needs no mapping skills. CNE publishes a hazard and natural-perils map for each canton as a printable PDF, listed by province on its Mapas de Amenazas page. Pick your province, then your canton, and you get a single sheet of a few megabytes that prints. Coverage is not quite complete, so if your canton is missing from the list, the interactive map below covers the whole country.[2]
The sheet shows rivers and quebradas, faults, landslides, flood-potential areas, mudflow paths, volcanic calderas and zones of cortical weakness, with the canton boundary drawn around them.
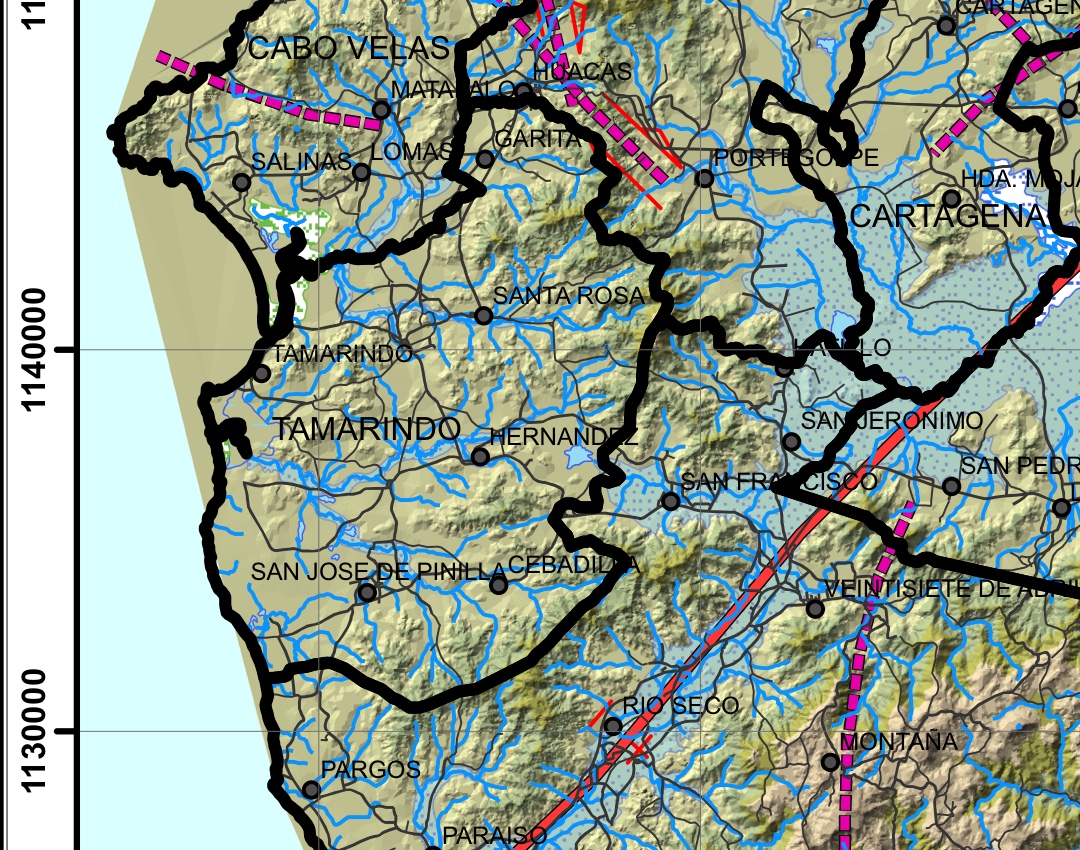
Detail from the Santa Cruz sheet, covering the coast around Tamarindo and Playa Grande. Red lines are Quaternary faults, dashed magenta are older paleotectonic faults, and the blue stippling east of the ridge marks flood-potential areas. Source: reference [3].
The sheet has one practical advantage over the interactive map: its marginal grid is CRTM05, the projected coordinate system named in the sheet's own legend and the same one your Costa Rican plano catastrado uses. If you already have the survey for a property, its coordinates can be plotted on this sheet directly, without conversion.[3]
Route two: the interactive map
CNE also publishes an interactive national hazard map, free and with no login. It carries the same official layers, served through the Sistema Nacional de Información Territorial (SNIT), the national territorial information system led by the Instituto Geográfico Nacional (IGN).[4]
It has a screening tool that produces a report, titled Situación del área de interés, listing what falls inside an area you define. Defining that area is the awkward part: you either draw the shape by hand on the map or upload a shapefile. Typed coordinates only move the map to a location; they do not feed the screening report. So the workflow is locate, draw, then screen, and the precision of your answer depends partly on how carefully you drew the outline.[5]
The interactive map also works in decimal degrees, while the canton PDF and your plano catastrado use projected meters, so moving between them means converting coordinates. If you are working from a survey, the PDF is the easier starting point.
What the layers cover
Seven hazard layers cover most of what matters: flood-potential areas, coastal floodable areas, landslides, landslide crowns (the upslope scarp where a slide detaches, which matters because it sits above the visible slide), faults, volcanoes and volcanic affectation areas.
The screening report also lists things that are not hazards at all: population centers, schools, drinking-water systems, shelters and fuel pipelines. Those are exposure and context layers, telling you what is inside your area rather than what threatens it. Reading a pipeline as a hazard finding is an easy mistake to make from the report alone.[6]
The scale problem, in numbers
CNE prints a warning on every canton sheet. The map is a producto preliminar, no exhaustivo, a preliminary and non-exhaustive product, drawn at 1:50,000. It is to be used, in the agency's own words, as a general reference orientation, and at no point as a substitute for specialized technical maps at finer scale or for local detailed studies for planning and construction. That is unusually candid for an official product, and the arithmetic shows why the warning is there.[7]
Source: scale arithmetic from the 1:50,000 figure in reference [7].
At 1:50,000, one millimeter on the sheet is fifty meters on the ground. A 1,000 square meter lot, a common size, is about 32 meters on a side, which renders as six tenths of a millimeter. The lot is about as wide as the ink used to draw the hazard boundary beside it. No amount of zooming into a digital version changes this, because the underlying data was compiled at that scale regardless of how it is displayed.[8]
What the maps do not tell you
A blank area does not mean safe. CNE states that information is limited "particularly for the areas that appear blank on the map." An unmarked area may have been surveyed and found clear, or it may never have been surveyed, and the map does not distinguish the two.[9]
The information is old. The Santa Cruz sheet above credits its fault and seismic content to research by Denyer, Montero and Alvarado published in 2006, and its base cartography to national survey sheets, without saying which parts were revised since, or when. The sheets show long-standing landscape features, not what a river did last October.[10]
The boundaries are approximate. CNE notes the mapped elements may need positional adjustment if transferred to finer scales.[11]
Where hazard mapping becomes binding
The maps are advisory. Ley N.º 8488 requires bodies drafting urban development plans to include risk prevention and mitigation, and gives CNE the job of advising municipalities on managing risk information and feeding it into their planes reguladores. Responsibility lies first with the municipality, and that is where the rules become binding.[12]
So the sequence is: CNE's hazard mapping informs the local Plan Regulador, the Plan Regulador governs the uso de suelo certificate, and the uso de suelo is what determines whether you can build and under what conditions. At least one municipality republishes CNE's hazard layers directly inside its own public mapping system, so a buyer there sees the same data its planners use.[13]
For a single house, the environmental evaluation route run by the Secretaría Técnica Nacional Ambiental (SETENA), which includes a geology and natural-hazards component, is generally aimed at development projects rather than individual buyers. Do not expect to file one, and do not assume someone else did.[14]
Putting it together on a specific property
Work in this order:
- Get the folio real and the plano catastrado, so you know exactly which parcel you are asking about and have its coordinates.
- Download the canton sheet and locate the parcel on it. Note every hazard element within a few hundred meters, not only those touching the boundary, since the line is approximate.
- Open the interactive map for the current version of the same layers, and run the screening tool if you want the written report.
- Take what you found to the municipality and request the uso de suelo for that parcel, which tells you what you may build. On the same visit, settle the other buildability questions: whether an operator will supply the lot with water and whether the lot has legal access, since a permit needs all three.
- Where the terrain is steep, recently cut, or near a watercourse, commission a local geotechnical or hydrological study. The national maps say explicitly that they do not substitute for one.
Steps one through three are free and take an afternoon. PropScan automates this kind of multi-source work into a single report, pulling registry, cadastral and municipal records together, though the hazard sheets themselves are public and worth opening yourself.
If you are reading this during the wet months, note that Costa Rica's rainy season is not a national condition. In mid-August 2026, while the Caribbean and Northern Zone were under orange alert with more than a thousand people in shelters and the San José to Limón highway cut in several places, Guanacaste carried no alert at all and the Pacific was in its driest stretch of the year. Which side of the country a property sits on changes the question entirely.[15]
Common questions
Are the hazard maps free to check?
Yes, and there are two public routes. The Comisión Nacional de Prevención de Riesgos y Atención de Emergencias publishes a printable hazard sheet for each canton as a PDF, and an interactive national map you can draw an area on to get a report. Neither requires a login, a fee, or any mapping software.
Does a hazard designation stop me building?
Not by itself. The maps feed into municipal planning; they do not decide permits. Binding restrictions reach you through the local Plan Regulador and the uso de suelo certificate your municipality issues, and that certificate governs what you may build.
My lot is not in a marked hazard area. Does that mean it is safe?
No. The maps carry an explicit warning that information is limited, particularly for areas left blank on the sheet. A blank area can mean no hazard was found or that nothing was surveyed there, so it should not be read as clearance.
How current is the mapping?
Not very, and the agency says so. The sheets are described as preliminary and non-exhaustive, and published metadata lists compilation sources going back around two decades. Treat the maps as a starting orientation: recent changes to the landscape will not appear on them.
Do I need an environmental study for a single house?
Usually not. The environmental evaluation process run by the Secretaría Técnica Nacional Ambiental, including its geology and natural-hazards component, is aimed at development projects rather than individual buyers of one lot. For a single house the practical route is the municipality and, where the terrain warrants it, a private geotechnical study.
Legal references and source notes
The numbered references below correspond to the markers in the article. Legal rules are sourced to Costa Rican statutes. Map content is sourced to the agency that publishes it, and press reporting is identified as such.
[1] Ley 8488, Ley Nacional de Emergencias y Prevención del Riesgo, art. 4. Amenaza is the "peligro latente representado por la posible ocurrencia de un fenómeno peligroso, de origen natural, tecnológico o provocado por el hombre, capaz de producir efectos adversos". Riesgo is the "probabilidad de que se presenten pérdidas, daños o consecuencias económicas, sociales o ambientales en un sitio particular y durante un período definido. Se obtiene al relacionar la amenaza con la vulnerabilidad de los elementos expuestos." Source: Ley 8488, PGR-SINALEVI.
[2] CNE publishes a Mapa de Amenazas y Peligros Naturales for each canton as a PDF, listed by province on its Mapas de Amenazas page. The index page blocks automated access, so coverage was confirmed by downloading individual sheets rather than by reading the list. Source: CNE, Mapas de Amenazas.
[3] The Santa Cruz canton sheet, read at full resolution. Its legend prints the projection as CRTM05 and credits the source as "Hojas Cartográficas (... IGN, Escala 1:50 000) / Proyección CRTM05 / Sector de Mitigación del Riesgo Volcánico y sísmico (OMIRYS) Trabajos de Investigación UCR/UNA-OVSICORI, RECOPE; ICE Y CNE, Percy Denyer, Walter Montero y Guillermo Alvarado, 2006." Source: CNE, Santa Cruz canton hazard sheet.
[4] The interactive map's About panel: "Este mapa contiene las capas oficiales de amenazas naturales presentes en el nodo de la CNE en el Sistema Nacional de Información Territorial (SNIT)." Its splash screen states that the map uses coordinates in decimal degrees, which is why a plano catastrado in projected meters does not plot on it directly. Source: CNE, Mapa interactivo de amenazas.
[5] The screening widget's configuration enables the drawing tools and the shapefile upload and disables the coordinate and place-name inputs, so a typed coordinate moves the map without defining the screened area. The report is titled "Mapa interactivo de amenazas: Situación del área de interés". Source: CNE, Mapa interactivo de amenazas.
[6] The layers screened are áreas con potencial de inundación, áreas costeras inundables, deslizamientos, coronas de deslizamiento, fallas, volcanes and áreas de afectación volcánica, together with poblados, schools, sistemas de agua potable, shelters, the poliducto and its valves. The last group records what is inside the area rather than what threatens it. Source: CNE, Mapa interactivo de amenazas.
[7] The Aclaración Importante box printed on each canton sheet: "El presente mapa de amenazas y peligros naturales es un producto preliminar, no exhaustivo, elaborado por la CNE a escala 1:50.000... este mapa debe de utilizarse como una orientación general de referencia sobre el tema y en ningún momento debe aplicarse como sustituto de mapas técnicos especializados realizados a menor escala... el mapa tampoco sustituye estudios técnicos locales realizados a escala detallada para la planificación y construcción de obras." The same sentence appears in the metadata the Municipalidad de Heredia publishes on its mirrored copy of the CNE layers. Sources: CNE, Santa Cruz canton hazard sheet and Municipalidad de Heredia, AmenazasCNE service metadata.
[8] Arithmetic from the 1:50,000 scale in reference [7], not a figure published by CNE: one millimeter on the sheet is 50 meters on the ground, so a 1,000-square-meter lot of about 32 meters a side renders at roughly 0.6 millimeters.
[9] From the same Aclaración Importante box: the map "tiene limitaciones de información, particularmente para las áreas que en el mapa aparecen en 'blanco'." Source: CNE, Santa Cruz canton hazard sheet.
[10] The 2006 date in the Santa Cruz legend attaches to the volcanic and seismic research inputs, not to the sheet as a whole, and nothing on the sheet dates the flood layers. What was revised after 2006 is not documented on the sheet. Source: CNE, Santa Cruz canton hazard sheet.
[11] From the same box: "los elementos de amenaza indicados pueden requerir ajustes de ubicación en caso de ser trasladados a escalas menores." The box also requires more detailed maps and studies to cite this map and explain any divergence. Source: CNE, Santa Cruz canton hazard sheet.
[12] Ley 8488, art. 8: bodies formulating urban development plans, programs and projects "deberán considerar el componente de prevención y mitigación del riesgo". Art. 14(h) gives CNE the task of advising municipalities on managing risk information and contributing to the drafting of planes reguladores, and places municipal responsibility "en primera instancia". Source: Ley 8488, PGR-SINALEVI.
[13] The Municipalidad de Heredia republishes the CNE hazard layers inside its own GIS as the service Comisión_Emergencias/AmenazasCNE. Source: Municipalidad de Heredia.
[14] SETENA's Documento de Evaluación Ambiental D1 carries a geology and natural-hazards component, and where the terrain's geoaptitud shows no significant hazard limitation a geological report may substitute for a fuller study. The process is aimed at projects rather than at the buyer of a single lot. Source: SETENA, D1 requirements list.
[15] Press reporting for August 2026. On August 17 around 500 people were in shelters and 862 schools were closed, with the Caribbean, Northern Zone and Turrialba under orange alert while Guanacaste carried no alert. On August 18 CNE was weighing a national emergency declaration, with 1,314 people in 23 shelters and Route 32 cut at eight points. No emergency decree had been issued at that date. Sources: Tico Times and Monumental.
This guide is informational and not a substitute for legal advice. For a purchase, work with an experienced attorney or notary.